本文转自: https://www.visualcapitalist.com/pla02-stablecoin-week-6-insights-shaping-the-future-of-money/
仅做个人收藏,版权归原作者所有
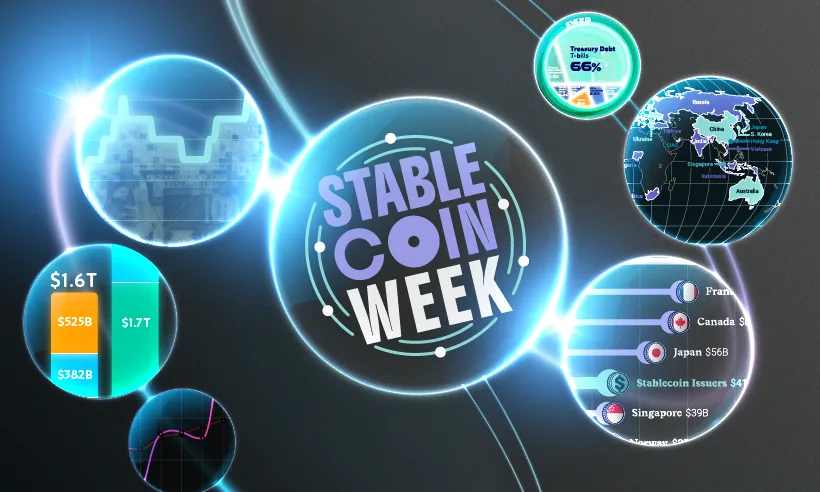
稳定币已从一种小众加密货币发展成为全球金融领域增长最快的势力之一。它们正在改变支付方式,甚至影响政府债务。
在稳定币周期间,我们与Plasma合作,Plasma是一个专为全球稳定币支付而构建的区块链,以探索这一变化的动态。从超越Visa的转账量到大胆的市场规模预测,该系列揭示了这一运动的规模。
以下是我们整理的六个关键要点。
1. 映射稳定币监管
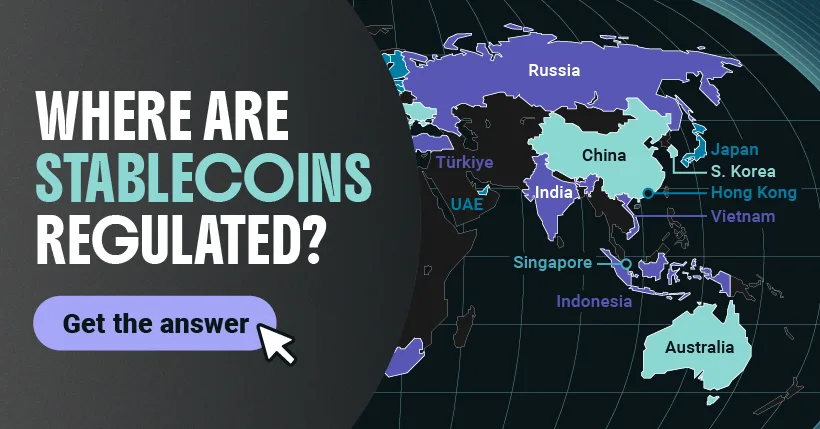
清晰的监管可以成为机构采用和跨境扩展的催化剂。然而,全球的监管状况差异很大。
一些国家对加密货币有明确的禁止,而另一些国家则制定了具体的法规,为发行者、托管人和/或用户设定了边界。

2.稳定币的资产支撑
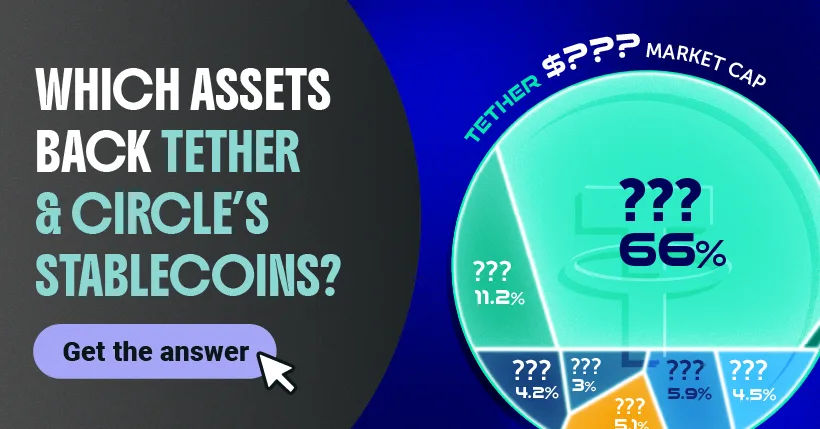
除了监管,稳定币与美元挂钩(占99%的稳定币)的稳定性有助于提升用户信心。但支撑这种稳定性的资产因发行方而异。Circle持有更为保守的资产负债表,而Tether则涉足了风险更高的资产。
3. 稳定币在美债市场中的作用
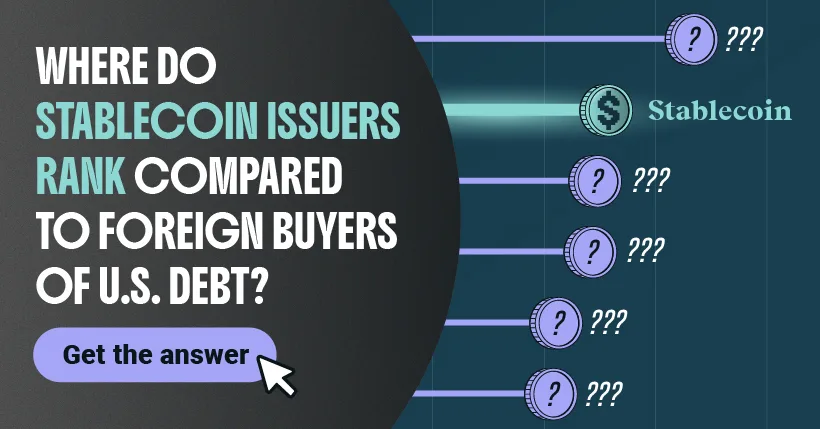
由于国库证券在稳定币发行方的储备中扮演重要角色,Tether和Circle购买了大量美债。事实上,他们的购买量在某些情况下超过了整个国家。
4. 稳定币 vs. Visa和Mastercard

除了债务市场,稳定币也是全球支付领域的重要参与者。它们的近实时、低成本转账推动了稳定币的普及。
早在2020年,稳定币的转账量远低于Visa或Mastercard。如今,稳定币已飙升至超越这两个主要支付网络。
5. 稳定币价值与美钞的比较

稳定币增长迅速,但要理解它们的增长幅度需要上下文。我们测量了稳定币市值相对于所有流通的实物美钞(包括纸币和硬币)的价值。
2020年,稳定币的价值仅相当于美钞流通量的1%。然而,过去五年它们的市值已大幅增长。
6. 2030年稳定币市场规模
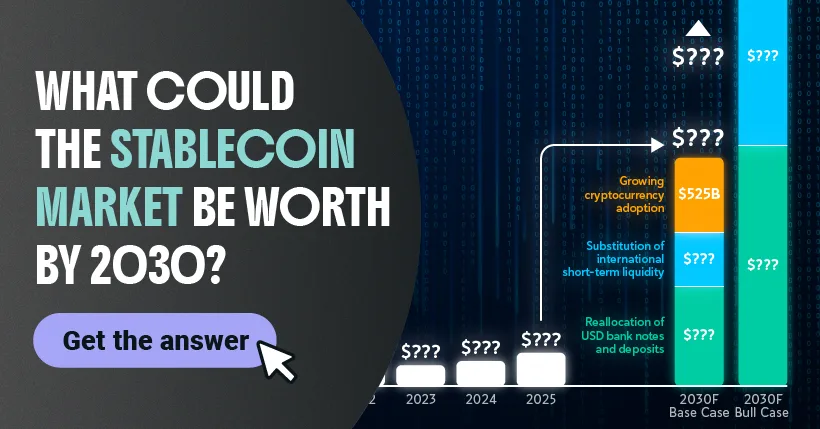
未来五年,稳定币行业可能达到多大的规模?根据花旗银行预测,到2030年,市场规模可能增长超过14倍。
专家预计,这一增长将由三个因素驱动:美国现金和存款向数字代币的转移、国际短期流动性工具被稳定币取代,以及稳定币在加密货币采用中的日益增长的作用。
展望未来:数字美元时代
稳定币已不再是金融的边缘。相反,它们正在重新定义资金流动的方式。从监管的演变到对传统支付方式的势头,它们的发展轨迹指向更深入的全球市场整合。
Plasma正在构建基础设施,以推动这一新时代,使全球稳定币交易能够以速度和规模转移资金。

—————
Stablecoins have gone from a niche cryptocurrency to one of the fastest-growing forces in global finance. They’re transforming payments and even influencing government debt.
For Stablecoin Week, we partnered with Plasma, a blockchain built for global stablecoin payments, to explore the shifting dynamics. From overtaking Visa in transfer volumes to bold market size forecasts, the series revealed just how big this movement has become.
Below, we’ve compiled six key takeaways.
1. Mapping Stablecoin Regulation
Clear regulations can be a catalyst for institutional adoption and cross-border expansion. However, the status of regulations differs quite a bit globally.
While some countries have outright bans on cryptocurrency, others have set out specific legislation that acts as guardrails for issuers, custodians, and/or users.
2. The Assets Backing Stablecoins
Alongside regulation, the stability of being pegged to the U.S. dollar (for 99% of stablecoins) helps boost confidence among users. But the assets held to support that stability differ depending on the issuer. Circle holds a more conservative balance sheet, while Tether has diversified into riskier assets.
3. Stablecoins’ Role in the U.S. Debt Market
Because Treasury securities play such a big role in the reserves of stablecoin issuers, Tether and Circle buy a lot of U.S. debt. So much, in fact, that their purchases surpass entire countries in some cases.
4. Stablecoins vs. Visa and Mastercard
Outside of debt markets, stablecoins are also a major player in the global payments landscape. Their near-instant, very low-cost transfers have fueled stablecoins’ popularity.
As recently as 2020, stablecoin transfer volume was far below that of Visa or Mastercard. Now, stablecoins have skyrocketed to outpace both major payment networks.
5. Comparing Stablecoin Value to U.S. Cash
Stablecoins are growing quickly, but it can be hard to grasp just how much they’re growing without context. We measured the stablecoin market cap relative to the value of all physical U.S. cash in circulation, which includes paper bills and coins.
In 2020, the value of stablecoins was equivalent to just 1% of U.S. cash in circulation. However, their market cap has surged over the last five years.
6. Stablecoin Market Size by 2030
How big could the stablecoin industry get within the next five years? According to Citi, the market could grow more than 14 times larger by 2030.
Experts expect this growth will be driven by three factors: the shift of U.S. cash and deposits into digital tokens, the replacement of international short-term liquidity tools with stablecoins, and the growing role of stablecoins as the backbone of cryptocurrency adoption.
Looking Ahead: The Digital Dollar Era
Stablecoins are no longer on the periphery of finance. Instead, they’re redefining how money moves. From evolving regulations to their momentum against traditional payment methods, their trajectory points toward deeper integration with global markets.
Plasma is building the infrastructure to power this next era, enabling global stablecoin transactions that move money with speed and scale.